Keeping time between the equinoxes
Ever noticed how there are more days between spring and fall than there are between fall and spring? If you do a rough tally of the days between March 21, and September 21 — the traditional starting dates of spring and fall — you find 184 days.
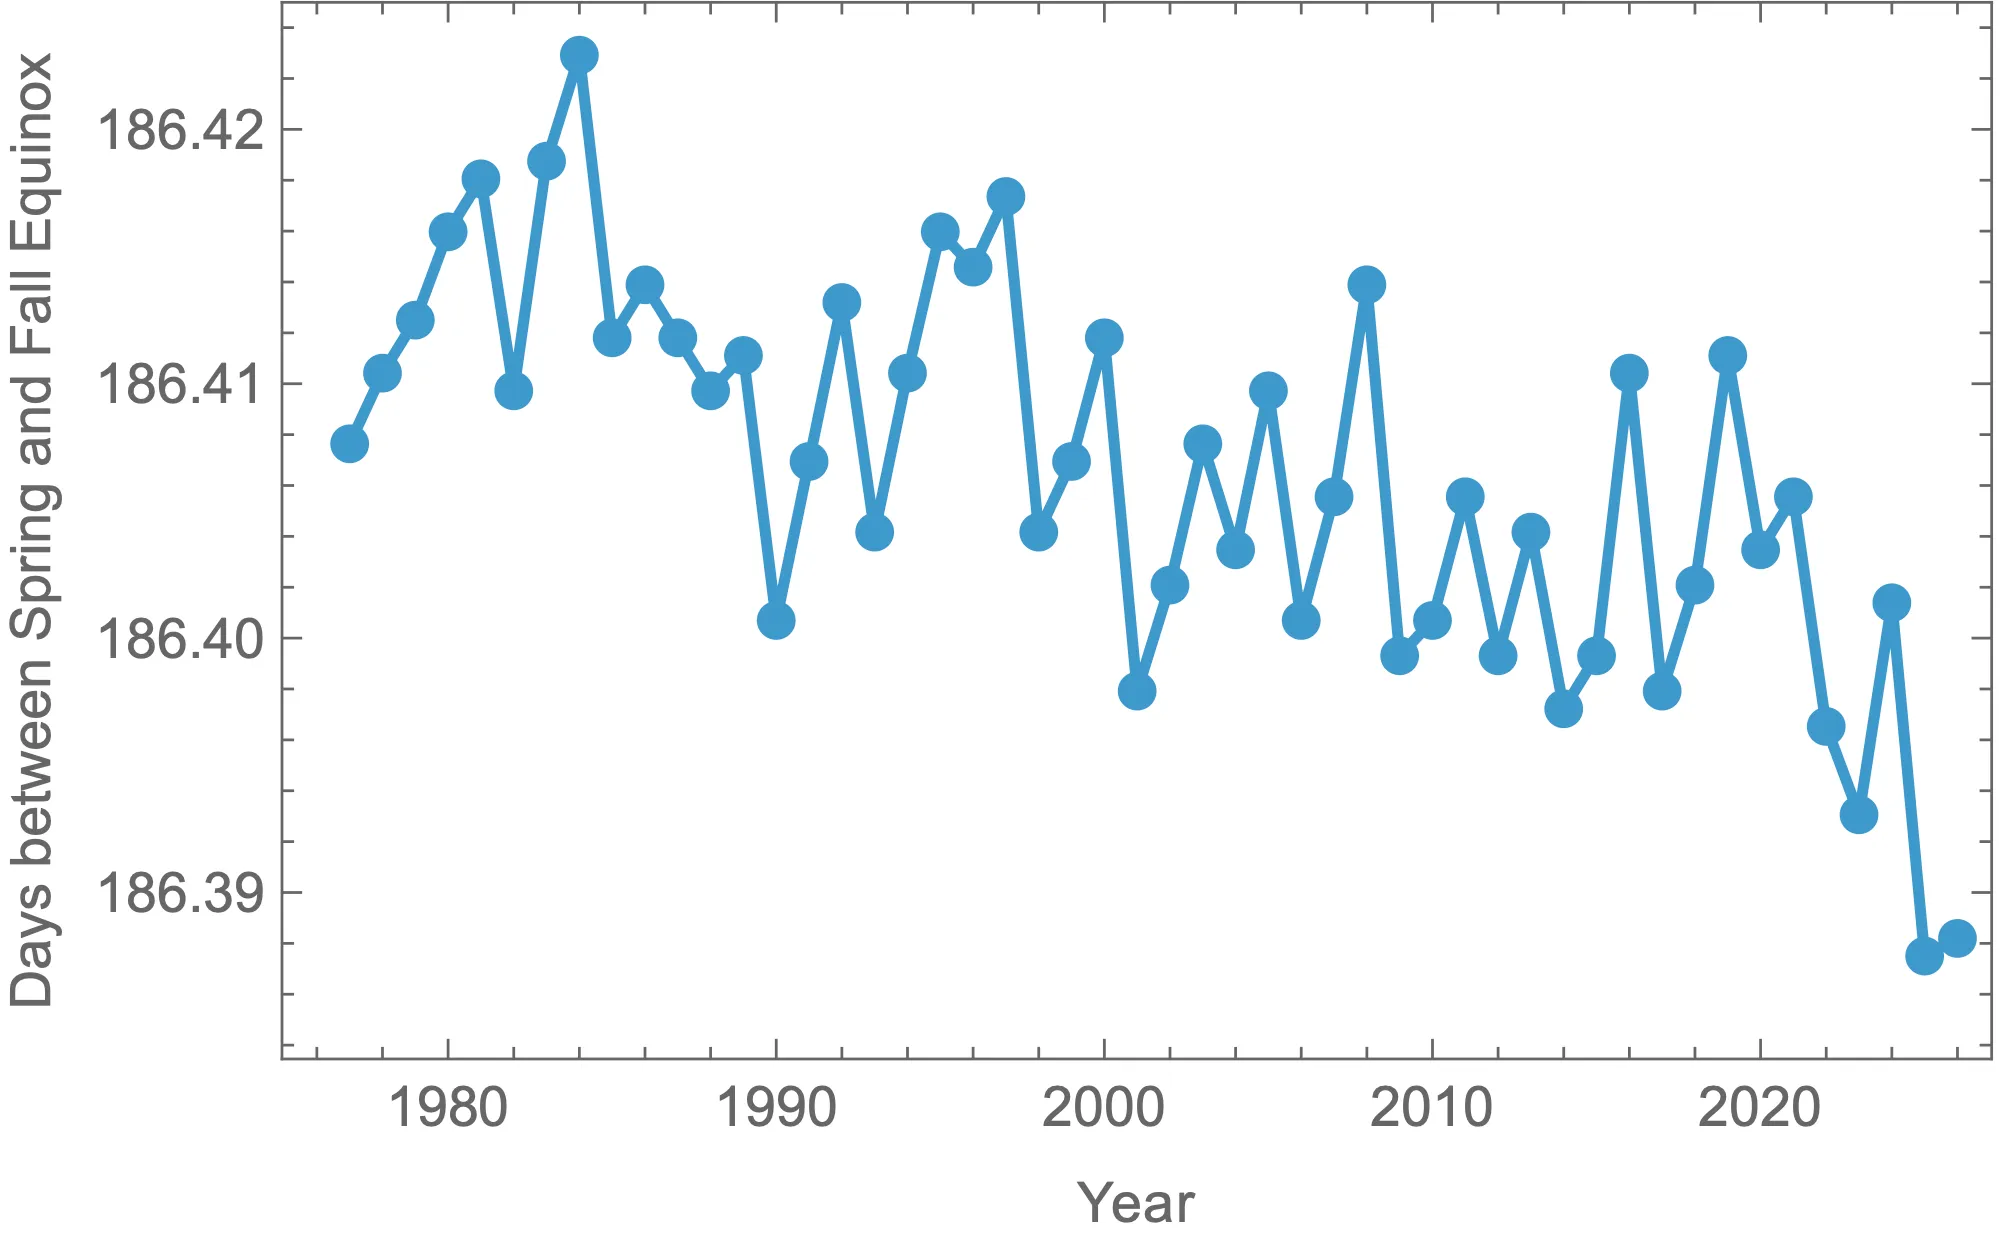
“Ah, but wait!” you say. “Those are approximations of the astronomical spring and fall equinoxes.” That’s a sharp observation. But if we pull up the actual dates from a database and compute the intervals, it gets even worse (see figure below).
Don’t get me wrong, I love the fact that summers are longer than winters in the northern hemisphere, where I live. One thing I also love is astronomy. And it can actually help us solve the mystery, and make us learn a thing or two in the process.
To get started, it helps to draw the orbit of the Earth around the Sun (see the next figure). For simplicity, let’s start by assuming that the Earth is closest to the Sun when it is at the winter solstice. This is not exactly true, and we will come back to this later, but it is close enough for the time being. By the way, this is why winters and summers are milder in the Northern hemisphere than in the South.
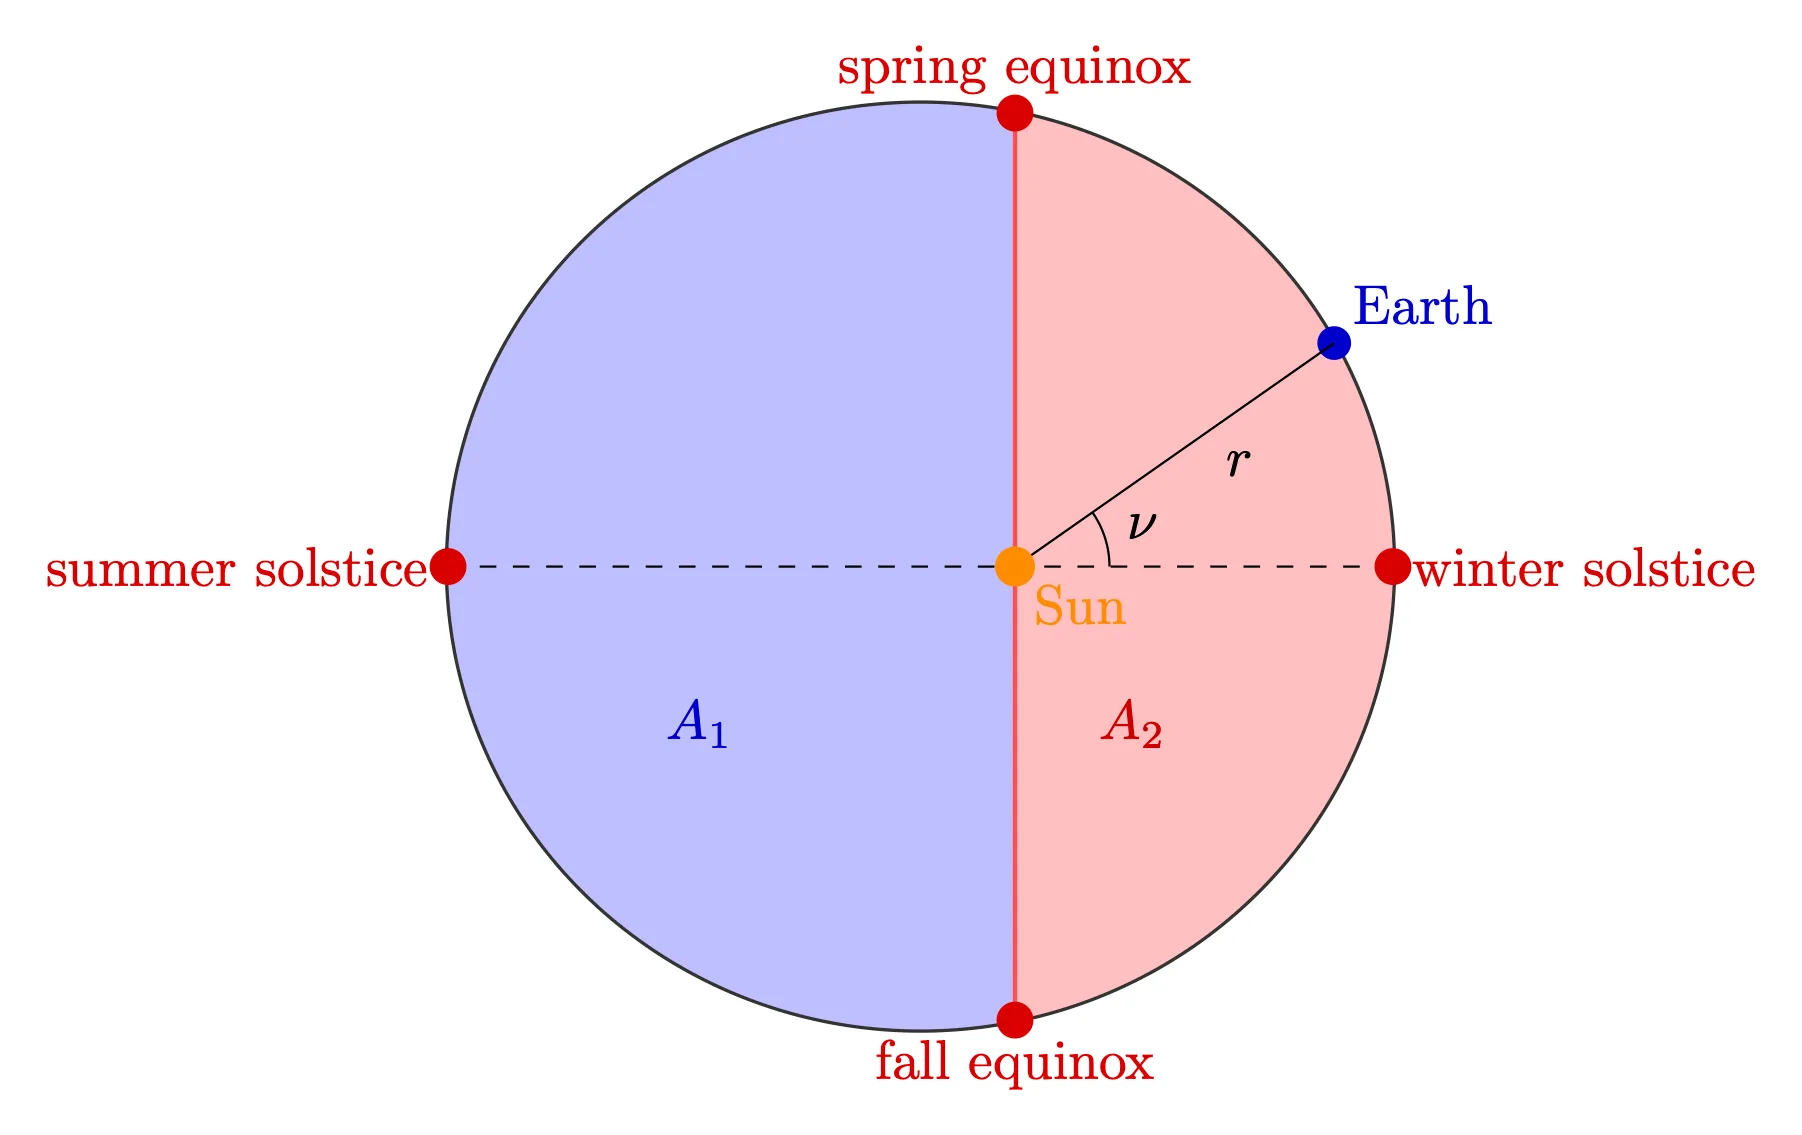
The equinoxes correspond to the points of intersection between the Earth’s orbit, and the plane going through its equator. The solstices are at midpoints between the equinoxes. The moments when the Earth crosses them is when the Sun appears higher (summer) and lower (winter) in the sky at noon.
Kepler taught us that the area swept out by the line
It is possible to compute these areas directly from the formula giving the position of the Earth along its orbit:
where
Both of these integrals can be evaluated exactly after plugging in Eq.
Using this, we finally get the ratio of the two areas:
where we have used
The left-hand side is equal to
We can get even closer by returning to our earlier simplification, and by taking into account the actual position of the winter solstice on the Earth’s orbit. In reality, the situation is closer to the figure below:
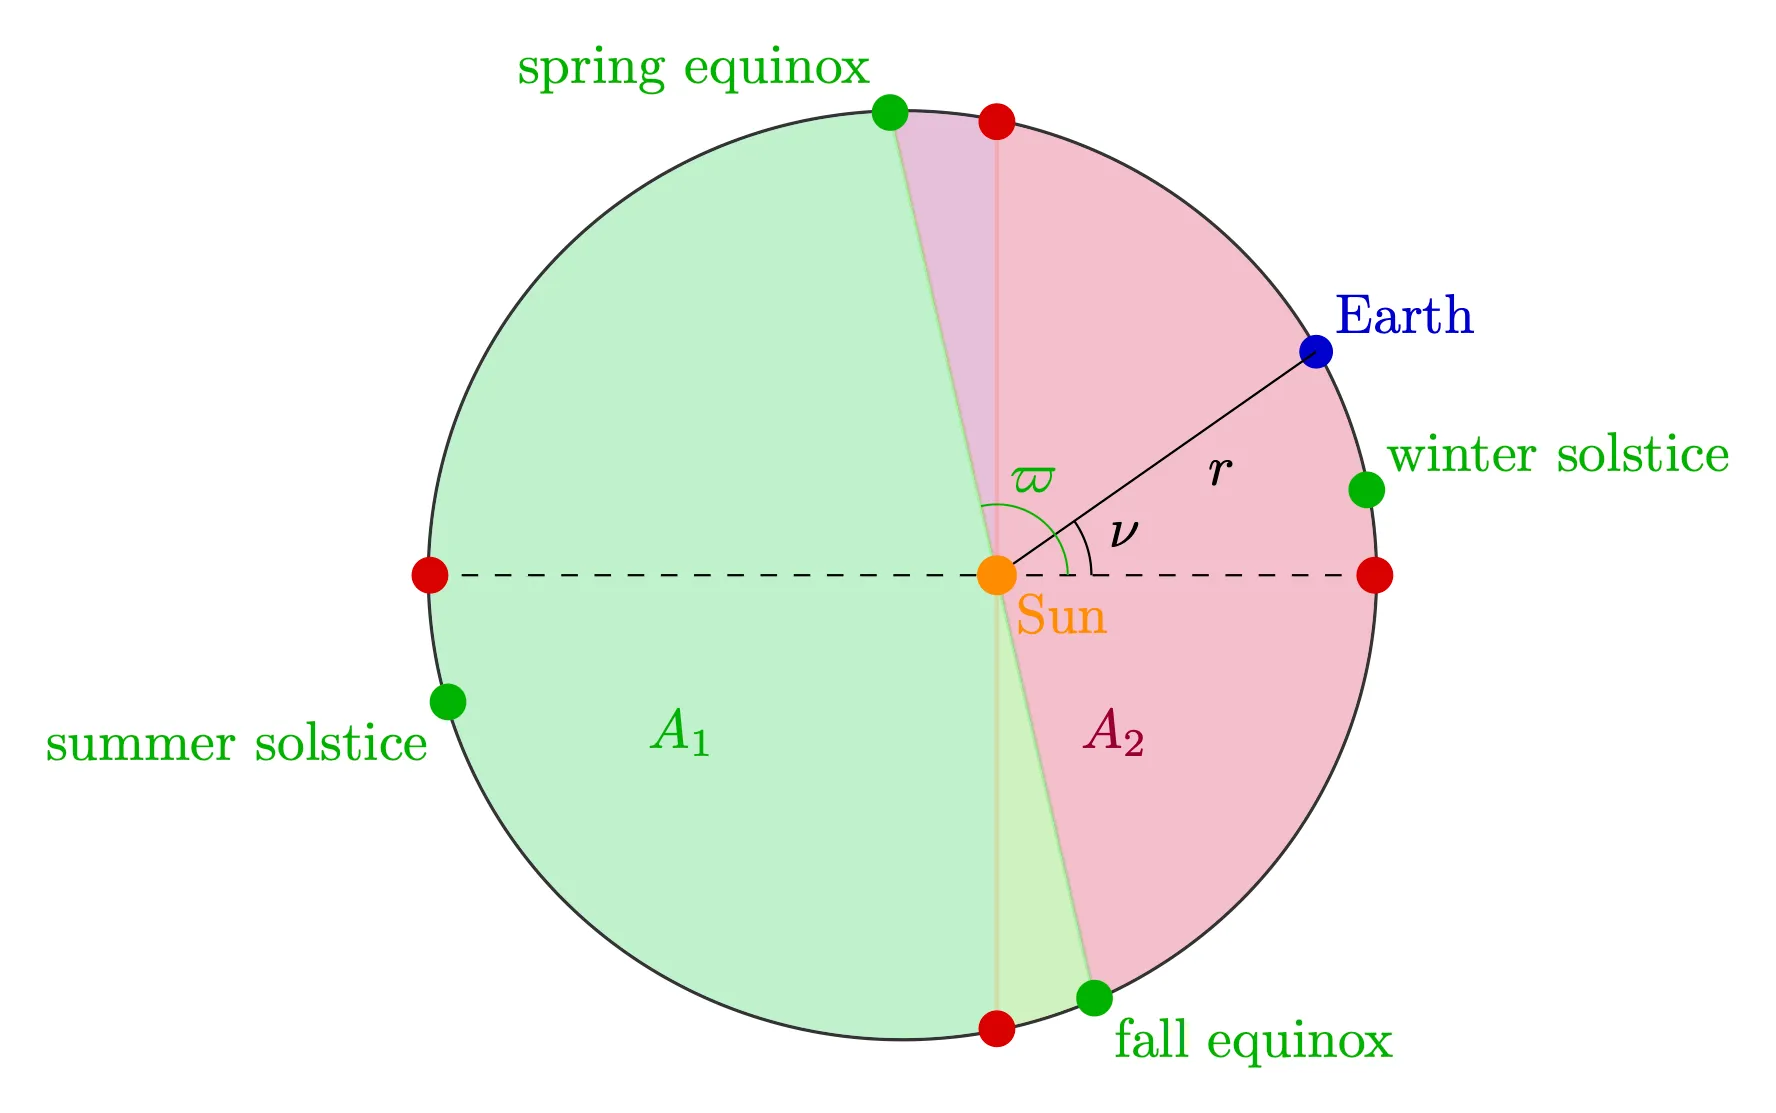
The quantity that matters here, is the angle
Repeating the rest of the computation modifies Eq.
Punching in the numbers gives
The longitude of the perihelion is not constant but changes in time. This is the reason behind the downward trend observable on the first figure and will be the object of a future post.
Like or comment on bluesky


github.com/jrekier/Tikz...